MobVis: A Framework for Analysis and Visualization of Mobility Traces
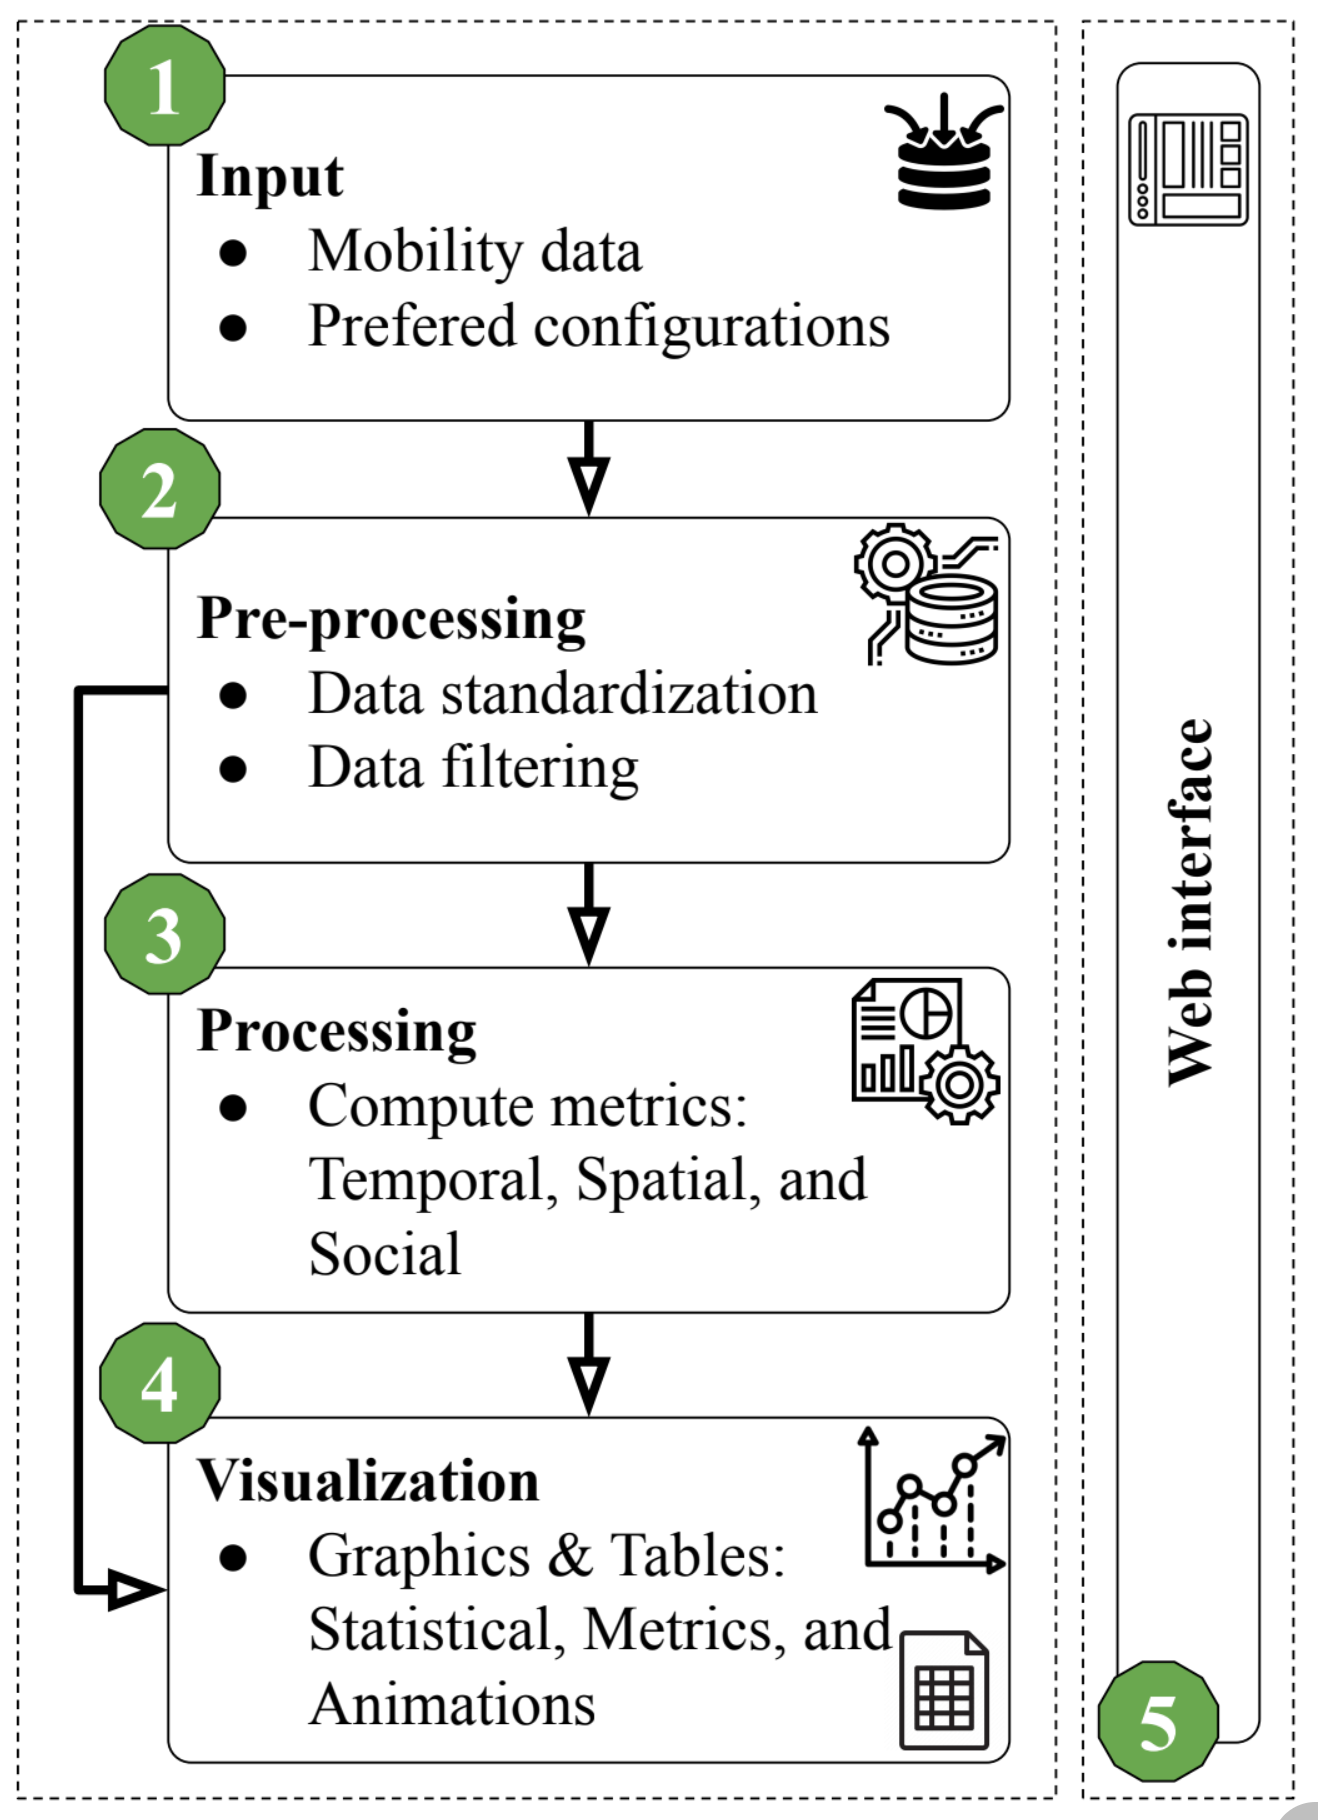
Due to the increasing location-aware devices, mobility traces datasets have become an essential source for smart cities planning. Given this scenario, we propose MobVis, a framework to characterize mobility traces through different metrics, allowing comparisons between different mobility traces in a simplified way. Furthermore, MobVis can extract and visualize spatial, temporal, and social aspects of mobility data through a Web interface. MobVis architecture has five main components: input data; data preparation; data processing and analysis to extract mobility metrics; visualization; and a web interface. To demonstrate the framework’s process, we created a use case analyzing the characteristics of two distinct traces (Taxi and IoT-Objects). Then, through different metrics, we evaluated the data in two aspects: i) descriptive, through a set of graphics and quantitative data that enables characterizing each trace; and ii) comparative, presenting the main differences between the traces.
Please cite:
@INPROCEEDINGS{silva2022mobvis,
  author={Silva, Lucas N. and Rettore, Paulo H.L. and Mota, Vinicius F.S. and Santos, Bruno P.},
  booktitle={2022 IEEE Symposium on Computers and Communications (ISCC)},
  title={MobVis: A Framework for Analysis and Visualization of Mobility Traces},
  year={2022},
  volume={},
  number={},
  pages={1-6},
  keywords={Measurement;Graphics;Data analysis;Smart cities;Data visualization;Libraries;Service-oriented architecture;Mobility;IoT;ITS;Smart Cities},
  doi={10.1109/ISCC55528.2022.9912988}
}
Lucas N. Silva; Paulo H.L. Rettore; Vinicius F.S. Mota; Bruno P. Santos.
Contatcs: {bruno.ps, rettore, lfvieira, loureiro}@dcc.ufmg.br
Founding agencies: CNPq/CAPES/FAPEMIG.


Leave a comment